
2026 RSM Classic at Sea Island Golf Club – Preview

Ron Klos

an hour ago

The PGA Tour heads to the Georgia coast to close out its schedule at Sea Island Resort on St. Simons Island. This week’s RSM Classic is the final event of the 2026 season, and at its conclusion, the top 100 players in the FedExCup standings will secure full status for next year.
Over the years, the RSM Classic has produced a number of longshot champions, among them Robert Streb (twice), Tyler Duncan, Austin Cook and Adam Svensson. Each of the last five champions has been a first-time winner on Tour, including Sami Valimaki last year. Their paths to victory have followed a similar pattern: finding fairways, attacking pins with wedges and short irons on approach, and converting their chances on the greens.
As is the case at most coastal venues, the strength of the wind tends to dictate how difficult the week will play. Even with a number of windy rounds, the average winning score since 2015 sits at 21 under par, with Ludvig Aberg posting the tournament record of 29 under in 2023.
Seaside will also have a new look this week. Love Golf Design, the firm led by Davis Love III and his brother Mark, carried out a two-phase restoration of the Tom Fazio design, completing the first phase in the summer of 2025 and the remainder this year. The project replaced the grass throughout the course, restored the bunkers and rebuilt the greens to USGA specifications, all while preserving the layout’s original character.
With daylight at a premium in mid November, the tournament is still able to accommodate a 145-player field through the use of two courses. Each player will see Seaside and Plantation once before the 36-hole cut, after which the top 65 and ties advance to play the weekend solely on Seaside.
The Field

This year’s 145-player field includes just one of the top 20 players in the Official World Golf Ranking in Michael Brennan, who stands well above the rest of the field. Behind him are six others ranked inside the world’s top 50: Sepp Straka, Michael Thorbjornsen, Harris English, Bud Cauley, Alex Smalley and Maverick McNealy. The field is thin at the top, particularly after Ludvig Aberg withdrew this week, but it runs deep with players fighting to secure their status for next season.
Brennan headlines the week after a breakout campaign. He has won three times on Tour in the past 13 months, most recently at the Baycurrent Classic in October, and he made the cut in all four majors this year. Five-time major champion Brooks Koepka is the most decorated name in the field, while Austin Smotherman arrives as the hottest player of the fall, having won both the Bank of Utah Championship and the Butterfield Bermuda Championship. They are joined by other notables, including Keegan Bradley, Brian Harman, Ben James, Keith Mitchell, Blades Brown, Jackson Koivun and Chad Ramey, who won last week’s Austin Championship.
As the final event of the FedExCup Fall, the RSM Classic is the last opportunity for players to improve their standing before 2027. Only the top 100 in the final standings will earn full PGA Tour cards, while those ranked 101st through 125th receive conditional status. Christiaan Bezuidenhout currently holds the 100th and final spot, with David Lipsky, Taylor Moore and Davis Thompson just ahead of him and Billy Horschel and Chandler Phillips sitting just outside.
There is also plenty at stake further up the list. Players who finish the fall ranked 51st through 60th make up the Aon Next 10 and earn spots in the first two Signature Events of 2027 at Pebble Beach and Riviera. Andrew Novak, Jordan Smith, Steven Fisk and Pierceson Coody are among those currently inside that group. Michael Kim and Max Homa also hold spots but are not in the field, which leaves them open to Ben Kohles, Doug Ghim and Harry Hall, who sit just outside the top 60.
Sea Island Golf Club – Course History
The Sea Island Golf Club and Resort originated in 1926, when its founder, Howard Coffin, purchased a former cotton plantation on the island with the intention of transforming it into one of the area’s first golf courses. Coffin brought in Walter Travis, a former three-time U.S. Amateur Tournament winner and renowned architect. He was known for designing classic Scottish Links-style courses along with “chocolate drop” mounds in the fairways and small, elevated greens.
Halfway through the completion of the Plantation course, Travis unexpectedly passed away. Coffin would not be deterred and brought in two other legendary architects, Harry S. Colt and Charles Alison, to finish what Travis had started. By 1929, the nine-hole Seaside and nine-hole Plantation courses were finally completed. In 1999, Tom Fazio was brought in to perform a complete renovation on the Seaside course that created the current routing of the holes.
Meanwhile, in 2019, the Plantation course was completely renovated by Davis Love III and his brother Mark, along with the Love Golf Design team. The goal was to take parts from both the original nine holes from the Plantation course and historical features from Walter Travis’s original layout to create a modern course that can be enjoyed by golfers of all playing levels.
The RSM Classic made its debut on the PGA Tour in 2010 at the Seaside course. Since 2015, the tournament has been played on both the Seaside and Plantation courses.
2025-2026 Restoration
Seaside has been fully restored since the Tour last visited Sea Island. Love Golf Design led the project alongside MacCurrach Golf Course Construction and Dylan Stafford, Sea Island’s director of golf maintenance, and his team. Groundwork began in July 2025, when the course closed for a month to renovate the fairway bunkers. The full restoration started this May, and Seaside reopened on October 19 with its original design preserved.
The playing surfaces are entirely new. Paspalum now runs from tee to green, while TifEagle Bermudagrass covers the putting surfaces. The greens and greenside bunkers were completely restored, and the 15th green was rebuilt from scratch. Newly rebuilt greens tend to play firmer for the first year or two, which could give Seaside more bite than the field is used to.
For Love, the restoration was about bringing back the dunes that once framed Tom Fazio’s design, along with adding length for the pros.
“All I wanted to do was put Tom Fazio’s sand dunes back,” Love said. “That was my main focus. The dunes had shrunk and we were trying to get them back. We added some sand on the marsh side, the front nine and added about 200 yards for the pros. For members and resort guests, it’s only about 25 yards longer.”
Love also knows how vulnerable the course can be when conditions are benign. “If it gets calm and it gets soft, you can’t stop these guys from making birdies,” Love said.
Finish Position and Strokes Gained History at Sea Island (2021-2025)
Course History at Seaside & Plantation
Click a column header to sort, and click again to reverse. CUT = missed cut, counted as 100 in Avg Finish. WD not counted in Avg Finish. SG: TOT is the total over all rounds at the course; the other SG columns are per round. SG: T2G to SG: PUTT use Seaside rounds only (no shot data at Plantation).
| Seaside & Plantation The RSM Classic |
Finish Position | Strokes Gained | ||||||||||||||||||
|---|---|---|---|---|---|---|---|---|---|---|---|---|---|---|---|---|---|---|---|---|
| Aaron Wise | CUT | CUT | 13 | 71.0 | 8 | 4.58 | 0.57 | 0.64 | 0.59 | 0.39 | 0.20 | 0.05 | 0.48 | |||||||
| Adam Hadwin | 70 | 53 | 51 | CUT | 68 | 68.4 | 18 | -11.51 | -0.64 | -0.49 | -0.41 | -0.05 | -0.36 | -0.08 | -0.17 | |||||
| Adam Schenk | CUT | 53 | 19 | CUT | 48 | CUT | 23 | CUT | 67.9 | 24 | -5.53 | -0.23 | 0.15 | 0.03 | 0.04 | -0.01 | 0.12 | 0.00 | ||
| Adam Svensson | CUT | 53 | 5 | 1 | CUT | CUT | 59.8 | 18 | 15.14 | 0.84 | 0.64 | 1.05 | 0.60 | 0.45 | -0.41 | 0.71 | ||||
| Adrien Dumont de Chassart | CUT | 25 | 62.5 | 6 | 3.25 | 0.54 | 1.39 | 0.76 | 0.39 | 0.37 | 0.63 | -1.35 | ||||||||
| Alejandro Tosti | CUT | 100.0 | 2 | -2.18 | -1.09 | 2.04 | 1.77 | 1.03 | 0.73 | 0.28 | -0.80 | |||||||||
| Alex Smalley | 62 | CUT | 44 | 5 | CUT | 62.2 | 16 | 11.94 | 0.75 | 0.94 | 0.82 | 0.43 | 0.39 | 0.12 | -0.49 | |||||
| Andrew Novak | 7 | 35 | 73 | CUT | 26 | CUT | 56.8 | 20 | 6.60 | 0.33 | -0.13 | -0.11 | -0.55 | 0.44 | -0.02 | 0.01 | ||||
| Andrew Putnam | 25 | CUT | 21 | CUT | 37 | CUT | 63.8 | 18 | 10.92 | 0.61 | 0.18 | -0.07 | -0.27 | 0.19 | 0.25 | 0.36 | ||||
| Austin Eckroat | 41 | 17 | 8 | 22.0 | 12 | 18.65 | 1.55 | 0.77 | 1.19 | 0.56 | 0.64 | -0.42 | 0.49 | |||||||
| Austin Smotherman | 42 | 53 | CUT | 40 | 58.8 | 14 | -2.64 | -0.19 | 0.13 | 0.56 | 0.09 | 0.47 | -0.43 | -0.28 | ||||||
| Ben Kohles | 34 | CUT | 5 | CUT | 59.8 | 12 | 5.01 | 0.42 | 0.84 | 1.03 | 0.11 | 0.92 | -0.19 | -0.32 | ||||||
| Ben Martin | 21 | CUT | 21 | CUT | 22 | CUT | 60.7 | 18 | 11.69 | 0.65 | 1.12 | 0.85 | 0.56 | 0.29 | 0.28 | -0.30 | ||||
| Ben Silverman | 47 | 46 | 8 | 33.7 | 12 | 12.85 | 1.07 | 0.03 | -0.28 | 0.21 | -0.49 | 0.31 | 0.65 | |||||||
| Billy Horschel | CUT | CUT | 2 | 67.3 | 8 | 7.58 | 0.95 | 0.61 | 0.66 | 0.80 | -0.14 | -0.04 | 1.05 | |||||||
| Blades Brown | CUT | 100.0 | 2 | 0.12 | 0.06 | 1.25 | 1.65 | 0.83 | 0.82 | -0.40 | 0.37 | |||||||||
| Brendon Todd | CUT | CUT | 28 | CUT | CUT | 37 | 4 | 54 | 65.4 | 24 | 11.60 | 0.48 | -0.07 | -0.34 | 0.09 | -0.43 | 0.27 | 0.38 | ||
| Brian Harman | CUT | 25 | 44 | 2 | 61 | CUT | 14 | 32 | 4 | CUT | 48.2 | 34 | 29.72 | 0.87 | 0.54 | 0.43 | 0.35 | 0.07 | 0.11 | 0.30 |
| Brice Garnett | 41 | CUT | CUT | 46 | CUT | CUT | CUT | 37 | 29 | 72.6 | 26 | 7.69 | 0.30 | 0.02 | 0.24 | 0.42 | -0.18 | -0.23 | 0.27 | |
| Bud Cauley | CUT | 25 | CUT | 8 | CUT | 66.6 | 14 | -0.34 | -0.02 | 0.76 | 0.29 | 0.33 | -0.04 | 0.47 | 0.00 | |||||
| Cam Davis | CUT | CUT | CUT | 100.0 | 6 | -12.98 | -2.16 | -0.63 | -0.34 | -0.13 | -0.21 | -0.29 | -0.52 | |||||||
| Chad Ramey | 62 | CUT | CUT | CUT | 90.5 | 10 | -8.34 | -0.83 | 1.16 | 0.67 | 0.84 | -0.17 | 0.49 | -0.80 | ||||||
| Chandler Phillips | CUT | 11 | 55.5 | 6 | 5.27 | 0.88 | -0.61 | 0.04 | 0.05 | -0.01 | -0.65 | 0.94 | ||||||||
| Chris Kirk | 41 | CUT | 28 | CUT | CUT | 18 | CUT | 46 | 4 | CUT | 63.7 | 30 | 20.12 | 0.67 | 0.54 | 0.42 | 0.14 | 0.29 | 0.12 | 0.04 |
| Christo Lamprecht | 64 | 64.0 | 4 | -0.45 | -0.11 | -1.24 | -0.84 | 0.67 | -1.51 | -0.41 | 1.42 | |||||||||
| Daniel Berger | 51 | 2 | 26.5 | 8 | 10.58 | 1.32 | 0.41 | 0.37 | 0.55 | -0.18 | 0.04 | 0.76 | ||||||||
| Danny Walker | CUT | 100.0 | 2 | 0.12 | 0.06 | -3.10 | -2.27 | -0.44 | -1.82 | -0.84 | 2.73 | |||||||||
| David Ford | CUT | CUT | 100.0 | 4 | -0.75 | -0.19 | 0.49 | 0.87 | -0.11 | 0.98 | -0.38 | -0.29 | ||||||||
| David Lingmerth | CUT | 10 | 43 | CUT | 17 | 54.0 | 16 | 13.77 | 0.86 | -0.07 | -0.14 | 0.05 | -0.19 | 0.07 | 0.89 | |||||
| David Lipsky | CUT | WD | CUT | 100.0 | 5 | -10.45 | -2.09 | -0.34 | -1.18 | -0.16 | -1.02 | 0.85 | -2.21 | |||||||
| David Skinns | CUT | CUT | 29 | CUT | 82.2 | 10 | -6.05 | -0.60 | 0.13 | -0.34 | 0.03 | -0.37 | 0.48 | 0.43 | ||||||
| Davis Riley | 67 | CUT | 46 | CUT | 76 | 77.8 | 16 | -11.29 | -0.71 | -0.90 | -0.38 | -0.65 | 0.26 | -0.52 | -0.41 | |||||
| Davis Thompson | 25 | 60 | 53 | CUT | CUT | CUT | 23 | 65.9 | 22 | -7.24 | -0.33 | 0.11 | 0.06 | 0.14 | -0.08 | 0.05 | -0.90 | |||
| Denny McCarthy | 51 | 25 | 5 | 46 | 10 | CUT | 8 | 46 | CUT | 43.4 | 32 | 29.15 | 0.91 | 0.22 | 0.07 | -0.01 | 0.07 | 0.15 | 1.13 | |
| Doug Ghim | 7 | 42 | CUT | 40 | 18 | 65 | 45.3 | 22 | 14.54 | 0.66 | 0.46 | 0.64 | 0.56 | 0.09 | -0.18 | 0.02 | ||||
| Dylan Wu | CUT | CUT | CUT | 46 | 51 | 79.4 | 14 | -2.93 | -0.21 | -0.64 | -0.23 | -0.36 | 0.13 | -0.41 | -0.24 | |||||
| Emiliano Grillo | CUT | 18 | 59.0 | 6 | 4.93 | 0.82 | 0.51 | 0.85 | 0.21 | 0.64 | -0.34 | 0.04 | ||||||||
| Eric Cole | 21 | 15 | 3 | 39 | 19.5 | 16 | 29.63 | 1.85 | 0.71 | 0.33 | -0.80 | 1.13 | 0.38 | 1.00 | ||||||
| Francisco Bidé | CUT | 100.0 | 2 | -14.18 | -7.09 | -5.65 | -5.82 | -0.77 | -5.05 | 0.17 | -1.11 | |||||||||
| Garrick Higgo | 53 | CUT | 76.5 | 6 | -1.57 | -0.26 | 1.25 | 0.41 | 0.67 | -0.26 | 0.84 | -1.71 | ||||||||
| Gordon Sargent | CUT | 100.0 | 2 | -4.28 | -2.14 | -1.83 | -1.08 | -0.04 | -1.04 | -0.74 | -0.39 | |||||||||
| Greyson Sigg | 25 | CUT | 8 | 15 | CUT | CUT | 49 | 56.7 | 22 | 13.50 | 0.61 | 0.62 | 0.54 | 0.08 | 0.46 | 0.08 | 0.25 | |||
| Hank Lebioda | CUT | CUT | CUT | CUT | 30 | 32 | 77.0 | 16 | -5.73 | -0.36 | 0.30 | 0.69 | 0.22 | 0.47 | -0.39 | -0.14 | ||||
| Harris English | 47 | 60 | 28 | 29 | CUT | 6 | CUT | 46 | CUT | CUT | 61.6 | 32 | 16.00 | 0.50 | 0.39 | 0.31 | 0.54 | -0.23 | 0.08 | 0.18 |
| Harry Hall | CUT | 100.0 | 2 | -1.27 | -0.64 | 0.54 | 1.11 | 0.61 | 0.50 | -0.57 | -0.11 | |||||||||
| Harry Higgs | CUT | 68 | 21 | CUT | CUT | 35 | 70.7 | 18 | -0.92 | -0.05 | -0.35 | -0.45 | -0.24 | -0.21 | 0.10 | -0.27 | ||||
| Hayden Springer | CUT | 30 | 65.0 | 6 | 0.85 | 0.14 | 0.49 | 0.69 | -0.49 | 1.18 | -0.20 | -0.16 | ||||||||
| J.T. Poston | 7 | 5 | 44 | 21 | CUT | CUT | 14 | CUT | CUT | CUT | 59.1 | 30 | 14.38 | 0.48 | 0.82 | 1.04 | 0.28 | 0.76 | -0.22 | 0.09 |
| Jackson Suber | 51 | 51.0 | 4 | 0.85 | 0.21 | 0.79 | 1.39 | 1.07 | 0.32 | -0.59 | -0.01 | |||||||||
| Jeremy Paul | CUT | 100.0 | 2 | -2.88 | -1.44 | -2.79 | -2.66 | -2.58 | -0.08 | -0.13 | -0.58 | |||||||||
| Jesper Svensson | 51 | 51.0 | 4 | 0.45 | 0.11 | 1.49 | 1.13 | 0.32 | 0.81 | 0.36 | -2.66 | |||||||||
| Joe Highsmith | CUT | 11 | 55.5 | 6 | 2.25 | 0.38 | 1.30 | 0.89 | 1.00 | -0.10 | 0.40 | -1.25 | ||||||||
| Joel Dahmen | CUT | 35 | 5 | 29 | 50 | CUT | 37 | 49 | CUT | 56.1 | 30 | 21.23 | 0.71 | 0.68 | 0.66 | 0.58 | 0.08 | 0.02 | 0.12 | |
| Johnny Keefer | 7 | 7.0 | 4 | 7.45 | 1.86 | 0.27 | -0.24 | -0.38 | 0.14 | 0.51 | 0.90 | |||||||||
| Justin Lower | CUT | CUT | CUT | CUT | CUT | 100.0 | 10 | -8.54 | -0.85 | -0.96 | -0.49 | -0.53 | 0.04 | -0.46 | -0.03 | |||||
| K.H. Lee | CUT | 58 | CUT | 5 | CUT | 72.6 | 14 | 6.85 | 0.49 | -0.40 | -0.48 | -0.21 | -0.27 | 0.09 | 1.22 | |||||
| Karl Vilips | 51 | 51.0 | 4 | 0.45 | 0.11 | 0.07 | -0.20 | -0.40 | 0.20 | 0.27 | -0.57 | |||||||||
| Keegan Bradley | CUT | 15 | 57.5 | 6 | -0.75 | -0.12 | 2.41 | 2.12 | 0.89 | 1.23 | 0.29 | -1.92 | ||||||||
| Keith Mitchell | 18 | CUT | CUT | 39 | 12 | 44 | 14 | CUT | 54 | 53.4 | 30 | 23.85 | 0.80 | 0.44 | 0.55 | 0.74 | -0.19 | -0.12 | -0.21 | |
| Kevin Kisner | CUT | CUT | 78 | 29 | CUT | 2 | CUT | 7 | 4 | CUT | 62.0 | 30 | 11.33 | 0.38 | 0.21 | 0.07 | 0.03 | 0.03 | 0.15 | 0.40 |
| Kevin Roy | CUT | CUT | 46 | 82.0 | 8 | -1.14 | -0.14 | -0.24 | -0.04 | -0.80 | 0.76 | -0.20 | 1.05 | |||||||
| Kevin Streelman | CUT | CUT | CUT | 35 | 51 | 54 | CUT | CUT | 17 | 36 | 69.3 | 30 | -7.51 | -0.25 | 0.33 | 0.26 | 0.43 | -0.17 | 0.07 | -0.76 |
| Kevin Yu | 11 | CUT | 54 | CUT | 66.2 | 12 | 4.13 | 0.34 | 0.29 | 0.10 | 0.77 | -0.67 | 0.19 | -0.41 | ||||||
| Kris Ventura | 34 | CUT | CUT | 78.0 | 8 | -1.87 | -0.23 | 0.18 | 0.45 | 0.46 | -0.01 | -0.27 | 1.00 | |||||||
| Lee Hodges | 4 | 5 | CUT | 57 | 54 | 44.0 | 18 | 16.15 | 0.90 | 0.54 | 0.08 | 0.00 | 0.08 | 0.46 | -0.39 | |||||
| Lucas Glover | 30 | CUT | 23 | 11 | 36 | 40.0 | 18 | 22.48 | 1.25 | 1.32 | 0.91 | 0.70 | 0.21 | 0.41 | -0.06 | |||||
| Ludvig Åberg | 17 | 1 | CUT | 39.3 | 10 | 21.44 | 2.14 | 1.25 | 1.00 | 0.53 | 0.47 | 0.25 | 0.87 | |||||||
| Luke Clanton | CUT | 2 | 51.0 | 6 | 7.85 | 1.31 | 0.84 | 0.99 | 1.23 | -0.25 | -0.14 | 0.49 | ||||||||
| Luke List | CUT | CUT | 19 | CUT | 10 | CUT | 53 | 4 | 13 | 55.4 | 28 | 23.69 | 0.85 | 1.14 | 1.34 | 0.89 | 0.46 | -0.21 | 0.21 | |
| Mac Meissner | 18 | 18.0 | 4 | 6.85 | 1.71 | 1.00 | 1.03 | 0.85 | 0.18 | -0.03 | 0.79 | |||||||||
| Mackenzie Hughes | 51 | 5 | 2 | CUT | 2 | CUT | 65 | CUT | CUT | 1 | 52.6 | 32 | 41.70 | 1.30 | 0.82 | 0.24 | 0.22 | 0.02 | 0.58 | 0.44 |
| Mark Hubbard | 34 | 35 | CUT | CUT | 53 | 79 | 66.8 | 19 | -1.10 | -0.06 | -0.39 | -0.47 | 0.26 | -0.73 | 0.08 | -1.01 | ||||
| Matt Kuchar | 67 | CUT | 53 | CUT | 37 | 37 | CUT | 29 | CUT | 69.2 | 28 | 1.18 | 0.04 | -0.40 | -0.42 | -0.02 | -0.40 | 0.02 | 0.00 | |
| Matt Wallace | 51 | 53 | CUT | 67 | 37 | 61.6 | 18 | -7.90 | -0.44 | -0.55 | -0.39 | -0.73 | 0.34 | -0.15 | -0.10 | |||||
| Matthieu Pavon | 67 | 67.0 | 4 | -2.55 | -0.64 | -1.38 | -1.39 | 0.39 | -1.78 | 0.02 | -0.45 | |||||||||
| Maverick McNealy | 1 | 58 | CUT | 53 | 53.0 | 14 | 4.63 | 0.33 | 0.32 | 0.23 | 0.31 | -0.08 | 0.09 | -0.30 | ||||||
| Max McGreevy | 2 | CUT | CUT | 16 | 54.5 | 12 | 9.26 | 0.77 | 0.28 | 0.12 | -0.27 | 0.39 | 0.16 | 0.31 | ||||||
| Michael Brennan | 51 | 51.0 | 4 | 0.45 | 0.11 | -0.55 | 0.00 | 0.57 | -0.58 | -0.55 | -0.61 | |||||||||
| Michael Thorbjornsen | 7 | 8 | 7.5 | 8 | 19.40 | 2.43 | 1.11 | 0.58 | 0.50 | 0.08 | 0.53 | 0.20 | ||||||||
| Nicholas Lindheim | 28 | WD | 13 | 54 | 31.7 | 13 | 9.90 | 0.76 | 0.42 | 0.36 | 0.01 | 0.35 | 0.06 | 0.70 | ||||||
| Patrick Fishburn | 34 | 8 | 21.0 | 8 | 11.98 | 1.50 | 1.13 | 0.84 | 0.18 | 0.65 | 0.29 | 0.19 | ||||||||
| Patrick Rodgers | 7 | 17 | 10 | 57 | CUT | CUT | 2 | CUT | 10 | 44.8 | 30 | 35.16 | 1.17 | 0.51 | 0.40 | 0.34 | 0.06 | 0.11 | 0.41 | |
| Patton Kizzire | 34 | 66 | 44 | 35 | CUT | 10 | 68 | 15 | 45 | CUT | 51.7 | 36 | 21.17 | 0.59 | -0.24 | -0.42 | -0.27 | -0.15 | 0.17 | 0.71 |
| Paul Peterson | CUT | 25 | 62.5 | 6 | 0.85 | 0.14 | -1.23 | -1.43 | -0.68 | -0.75 | 0.19 | 0.32 | ||||||||
| Peter Malnati | CUT | CUT | CUT | 40 | 48 | CUT | CUT | CUT | CUT | 87.6 | 22 | -21.22 | -0.96 | -0.43 | -0.45 | 0.06 | -0.51 | 0.02 | -0.33 | |
| Pierceson Coody | 51 | CUT | 75.5 | 6 | -5.91 | -0.98 | 1.67 | 1.96 | 0.42 | 1.53 | -0.29 | -2.53 | ||||||||
| Rafael Campos | CUT | CUT | CUT | CUT | 100.0 | 8 | -10.50 | -1.31 | -0.06 | -0.22 | -0.18 | -0.04 | 0.16 | -1.57 | ||||||
| Ricky Castillo | 3 | 3.0 | 4 | 10.85 | 2.71 | 0.32 | -0.34 | -0.19 | -0.15 | 0.66 | 2.13 | |||||||||
| Rico Hoey | 7 | 7.0 | 4 | 7.85 | 1.96 | 0.73 | 1.28 | 0.36 | 0.92 | -0.55 | -0.28 | |||||||||
| Rikuya Hoshino | CUT | 100.0 | 2 | -1.28 | -0.64 | -1.74 | -2.09 | 0.62 | -2.71 | 0.34 | 1.53 | |||||||||
| Ryo Hisatsune | CUT | 17 | 58.5 | 6 | 1.25 | 0.21 | -0.44 | -0.36 | 0.10 | -0.46 | -0.08 | 0.74 | ||||||||
| S.Y. Noh | 30 | WD | 15 | 57 | 34.0 | 13 | 10.61 | 0.82 | -0.14 | -0.32 | -0.29 | -0.03 | 0.18 | 0.37 | ||||||
| Sam Stevens | 7 | 42 | CUT | CUT | 62.2 | 12 | 4.59 | 0.38 | 1.52 | 1.44 | 1.10 | 0.33 | 0.08 | -0.70 | ||||||
| Sami Valimaki | 1 | 1.0 | 4 | 12.85 | 3.21 | 1.76 | 1.34 | 0.58 | 0.76 | 0.42 | 1.69 | |||||||||
| Sepp Straka | CUT | CUT | CUT | 44 | CUT | CUT | 90.7 | 14 | -27.54 | -1.97 | 0.51 | 0.25 | -0.37 | 0.63 | 0.26 | -0.71 | ||||
| Steven Fisk | CUT | 49 | 74.5 | 6 | -0.15 | -0.03 | -1.50 | -1.46 | -0.12 | -1.34 | -0.05 | -0.16 | ||||||||
| Takumi Kanaya | CUT | 100.0 | 2 | -3.28 | -1.64 | 1.32 | -0.27 | -0.15 | -0.12 | 1.60 | -1.54 | |||||||||
| Taylor Moore | CUT | 35 | CUT | 8 | 60.8 | 12 | 1.35 | 0.11 | 0.21 | 0.03 | -0.07 | 0.09 | 0.18 | 0.82 | ||||||
| Taylor Pendrith | CUT | 15 | 26 | 47.0 | 10 | 12.11 | 1.21 | 0.33 | 0.74 | 0.90 | -0.15 | -0.41 | 1.25 | |||||||
| Trace Crowe | CUT | 100.0 | 2 | -9.18 | -4.59 | -3.92 | -3.28 | -0.73 | -2.54 | -0.64 | -0.84 | |||||||||
| Troy Merritt | 51 | CUT | CUT | CUT | 22 | CUT | 30 | 23 | 54 | CUT | 68.0 | 30 | -5.34 | -0.18 | 0.16 | -0.06 | 0.34 | -0.39 | 0.21 | -0.13 |
| Tyler Duncan | CUT | CUT | 3 | CUT | CUT | CUT | 1 | 74 | 25 | 67.0 | 26 | 16.17 | 0.62 | 0.71 | 0.93 | 0.54 | 0.39 | -0.22 | -0.14 | |
| Vince Whaley | 34 | 8 | 13 | 63 | CUT | 65 | 47.2 | 22 | 11.63 | 0.53 | -0.14 | -0.26 | 0.31 | -0.57 | 0.12 | 0.46 | ||||
| Webb Simpson | 25 | CUT | CUT | CUT | 8 | 37 | 2 | 3 | WD | 36 | 45.7 | 32 | 38.37 | 1.20 | 1.38 | 1.28 | 0.16 | 1.13 | 0.09 | 0.09 |
| Will Gordon | CUT | 30 | 36 | 15 | CUT | 10 | 48.5 | 20 | 19.75 | 0.99 | 1.10 | 1.04 | 0.36 | 0.68 | 0.06 | -0.19 | ||||
| William Mouw | 21 | 21.0 | 4 | 5.45 | 1.36 | 0.99 | 0.28 | -0.46 | 0.74 | 0.71 | -0.15 | |||||||||
| Zac Blair | 7 | CUT | CUT | 29 | CUT | CUT | 57 | 70.4 | 20 | 5.07 | 0.25 | 1.25 | 1.10 | 0.27 | 0.83 | 0.15 | -0.47 | |||
| Zecheng Dou | CUT | CUT | 67 | CUT | 91.8 | 10 | -6.20 | -0.62 | -0.08 | -0.45 | -0.90 | 0.45 | 0.37 | -1.37 |
Course Features
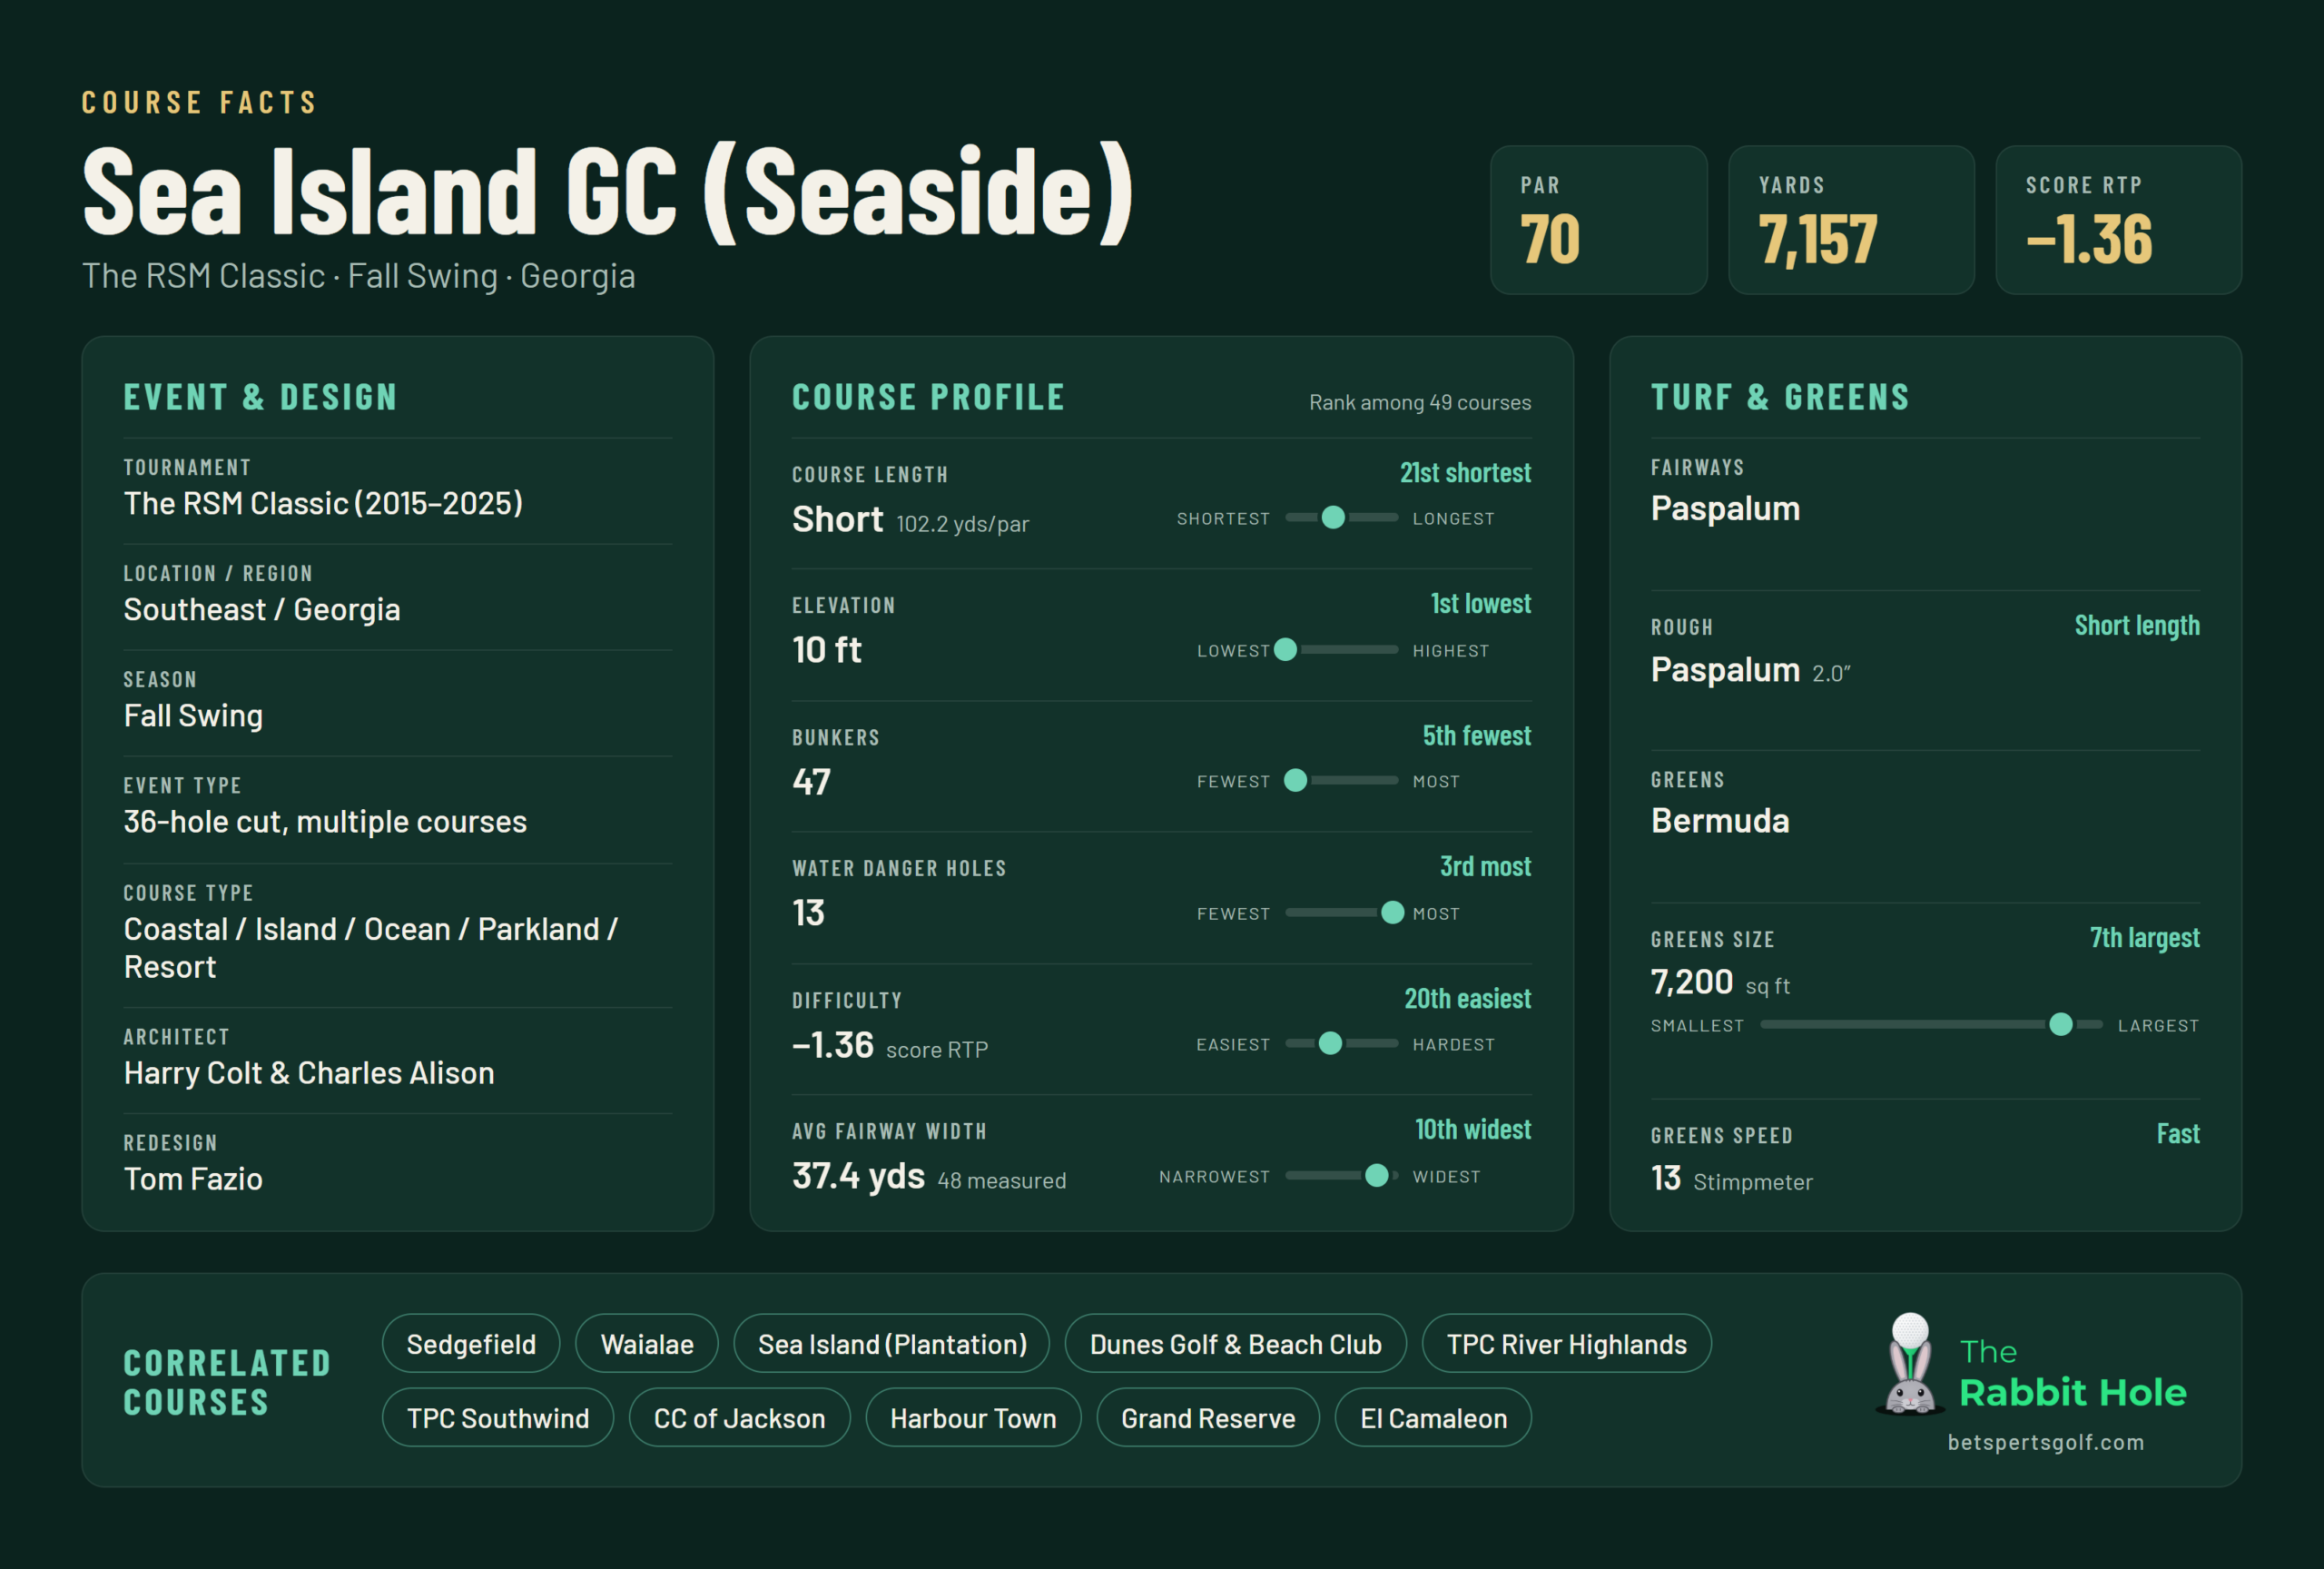
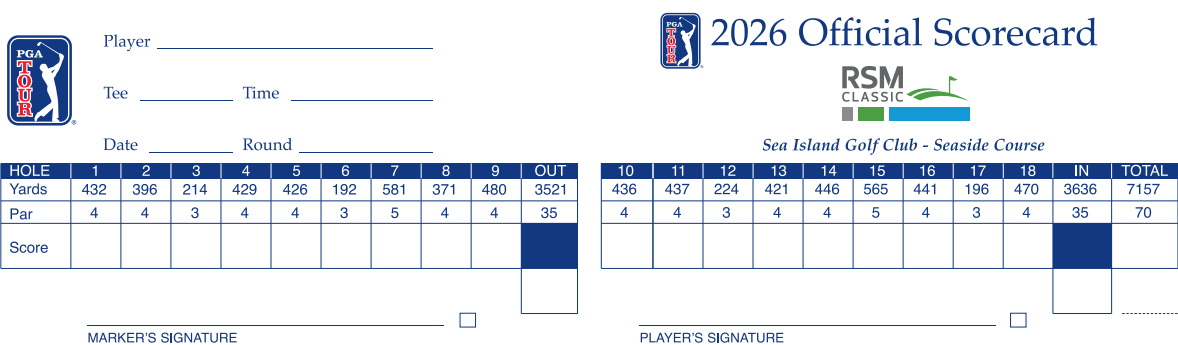
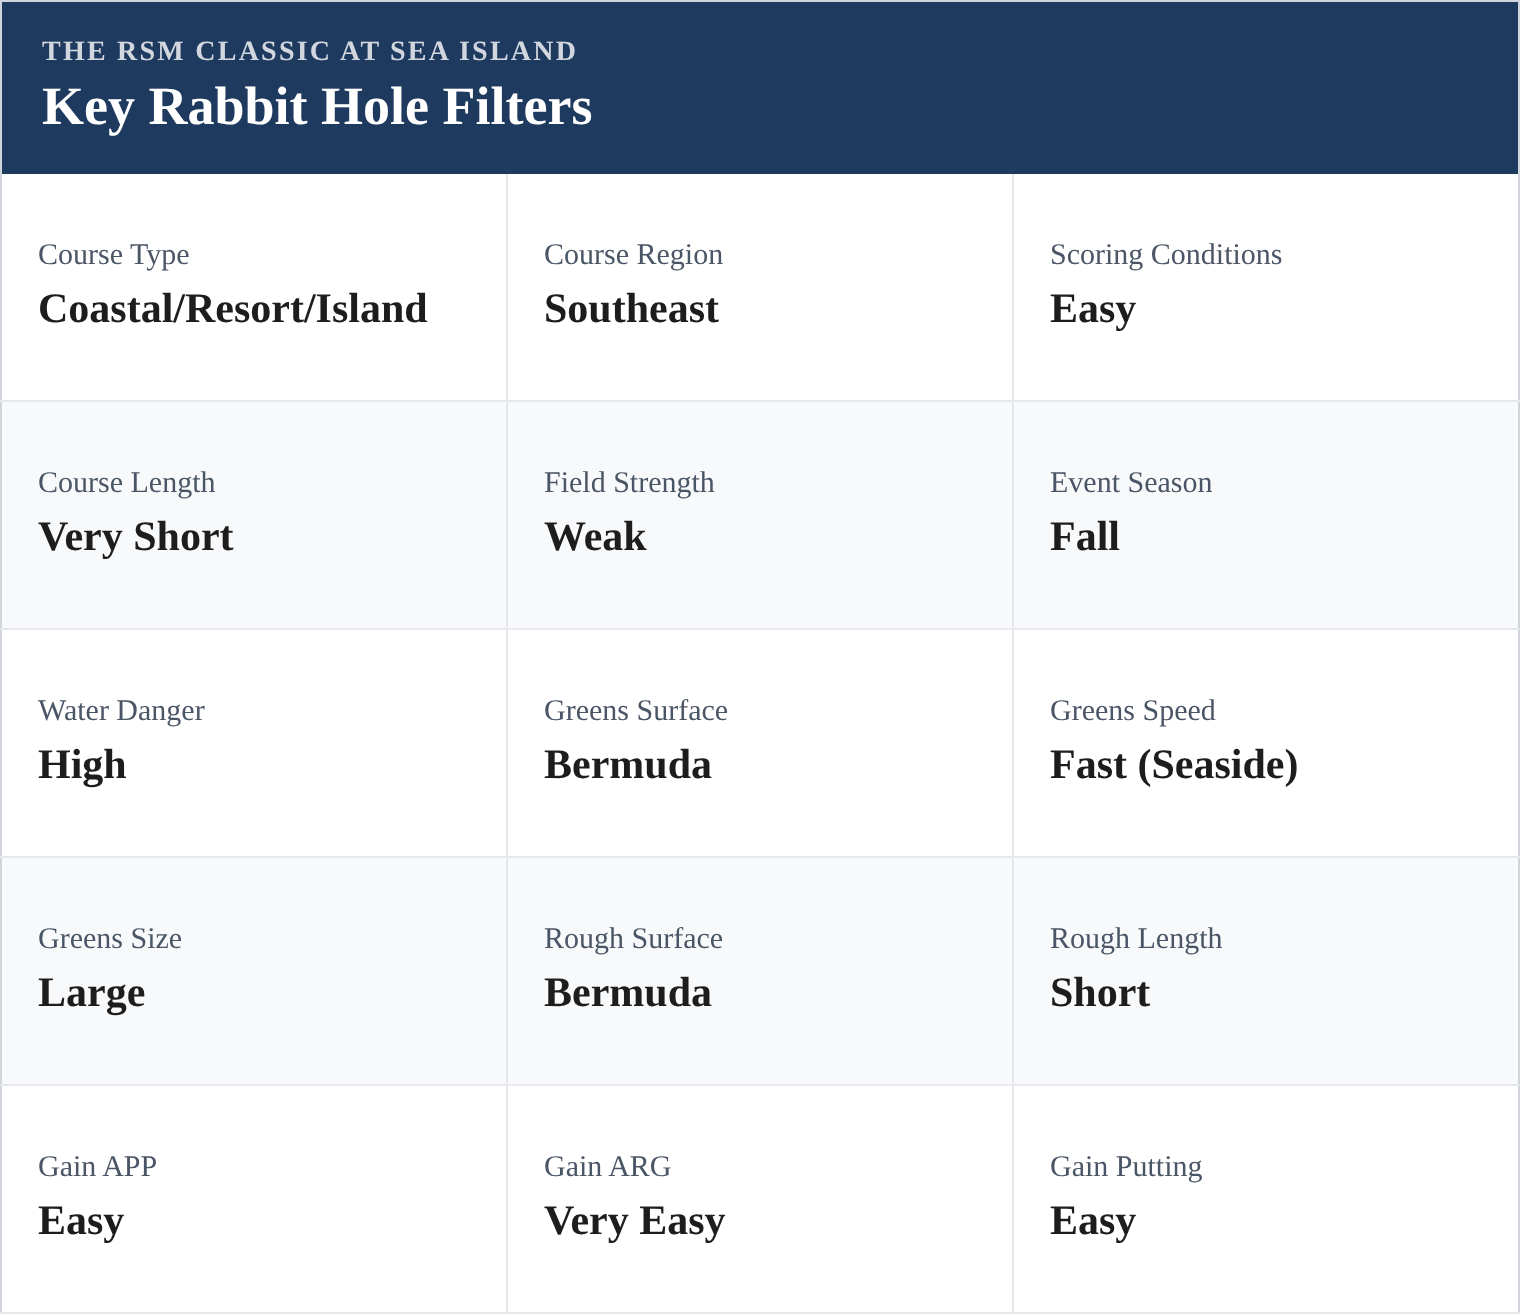
The main course at the RSM Classic, hosting three of the four rounds this week, is Seaside. The par-70 layout meanders along the coastal marshlands of St. Simons Sound and now measures 7,157 yards, 152 yards longer than a year ago. Nine holes picked up at least 10 yards, led by the 16th (34 yards) and the ninth (28 yards), while the second was shortened by 19 yards.
Seaside was created as a links-style course, surrounded by tidal creeks, man-made dunes and the Atlantic Ocean. While the ground game becomes useful when the wind picks up, it plays nothing like a true links. It features the 10th widest fairways on Tour at just over 37 yards on average, along with the seventh largest greens at roughly 7,200 square feet, which have historically been among the easier on Tour to putt.
Wind and water are the main defenses. Seaside has 13 holes with water in play, the third most on Tour, and its exposed position on the coast leaves it far more vulnerable to the wind than Plantation. Since 2016, it has played close to a full stroke tougher relative to par than Plantation over the first two rounds, when the field is split between the courses. With only 47 bunkers, the fifth fewest on Tour, it has also been one of the easier courses to get up and down on.
Even with only two par 5s, Seaside’s long holes must be capitalized on, as they are the best scoring chances on the course. The 565-yard 15th has played as the easiest hole over the last five years, with 64% of players making birdie or better, and the 581-yard seventh ranks second. The four par 3s now range from 192 to 224 yards, and two of them, the third and 12th, rank among the most difficult holes on the course.
Ultimately, though, success on the 12 par 4s will shape the leaderboard. Over the past five years, five of the seven hardest holes at Seaside have been par 4s, led by the 446-yard 14th. Only two par 4s now measure under 420 yards, compared with seven a year ago. That matters because Seaside has long been a wedge and short iron course, with 63% of approach shots coming from inside 175 yards over the last five years compared with 56% on Tour. Expect that share to drop this week, with more second shots coming from 150 to 200 yards.
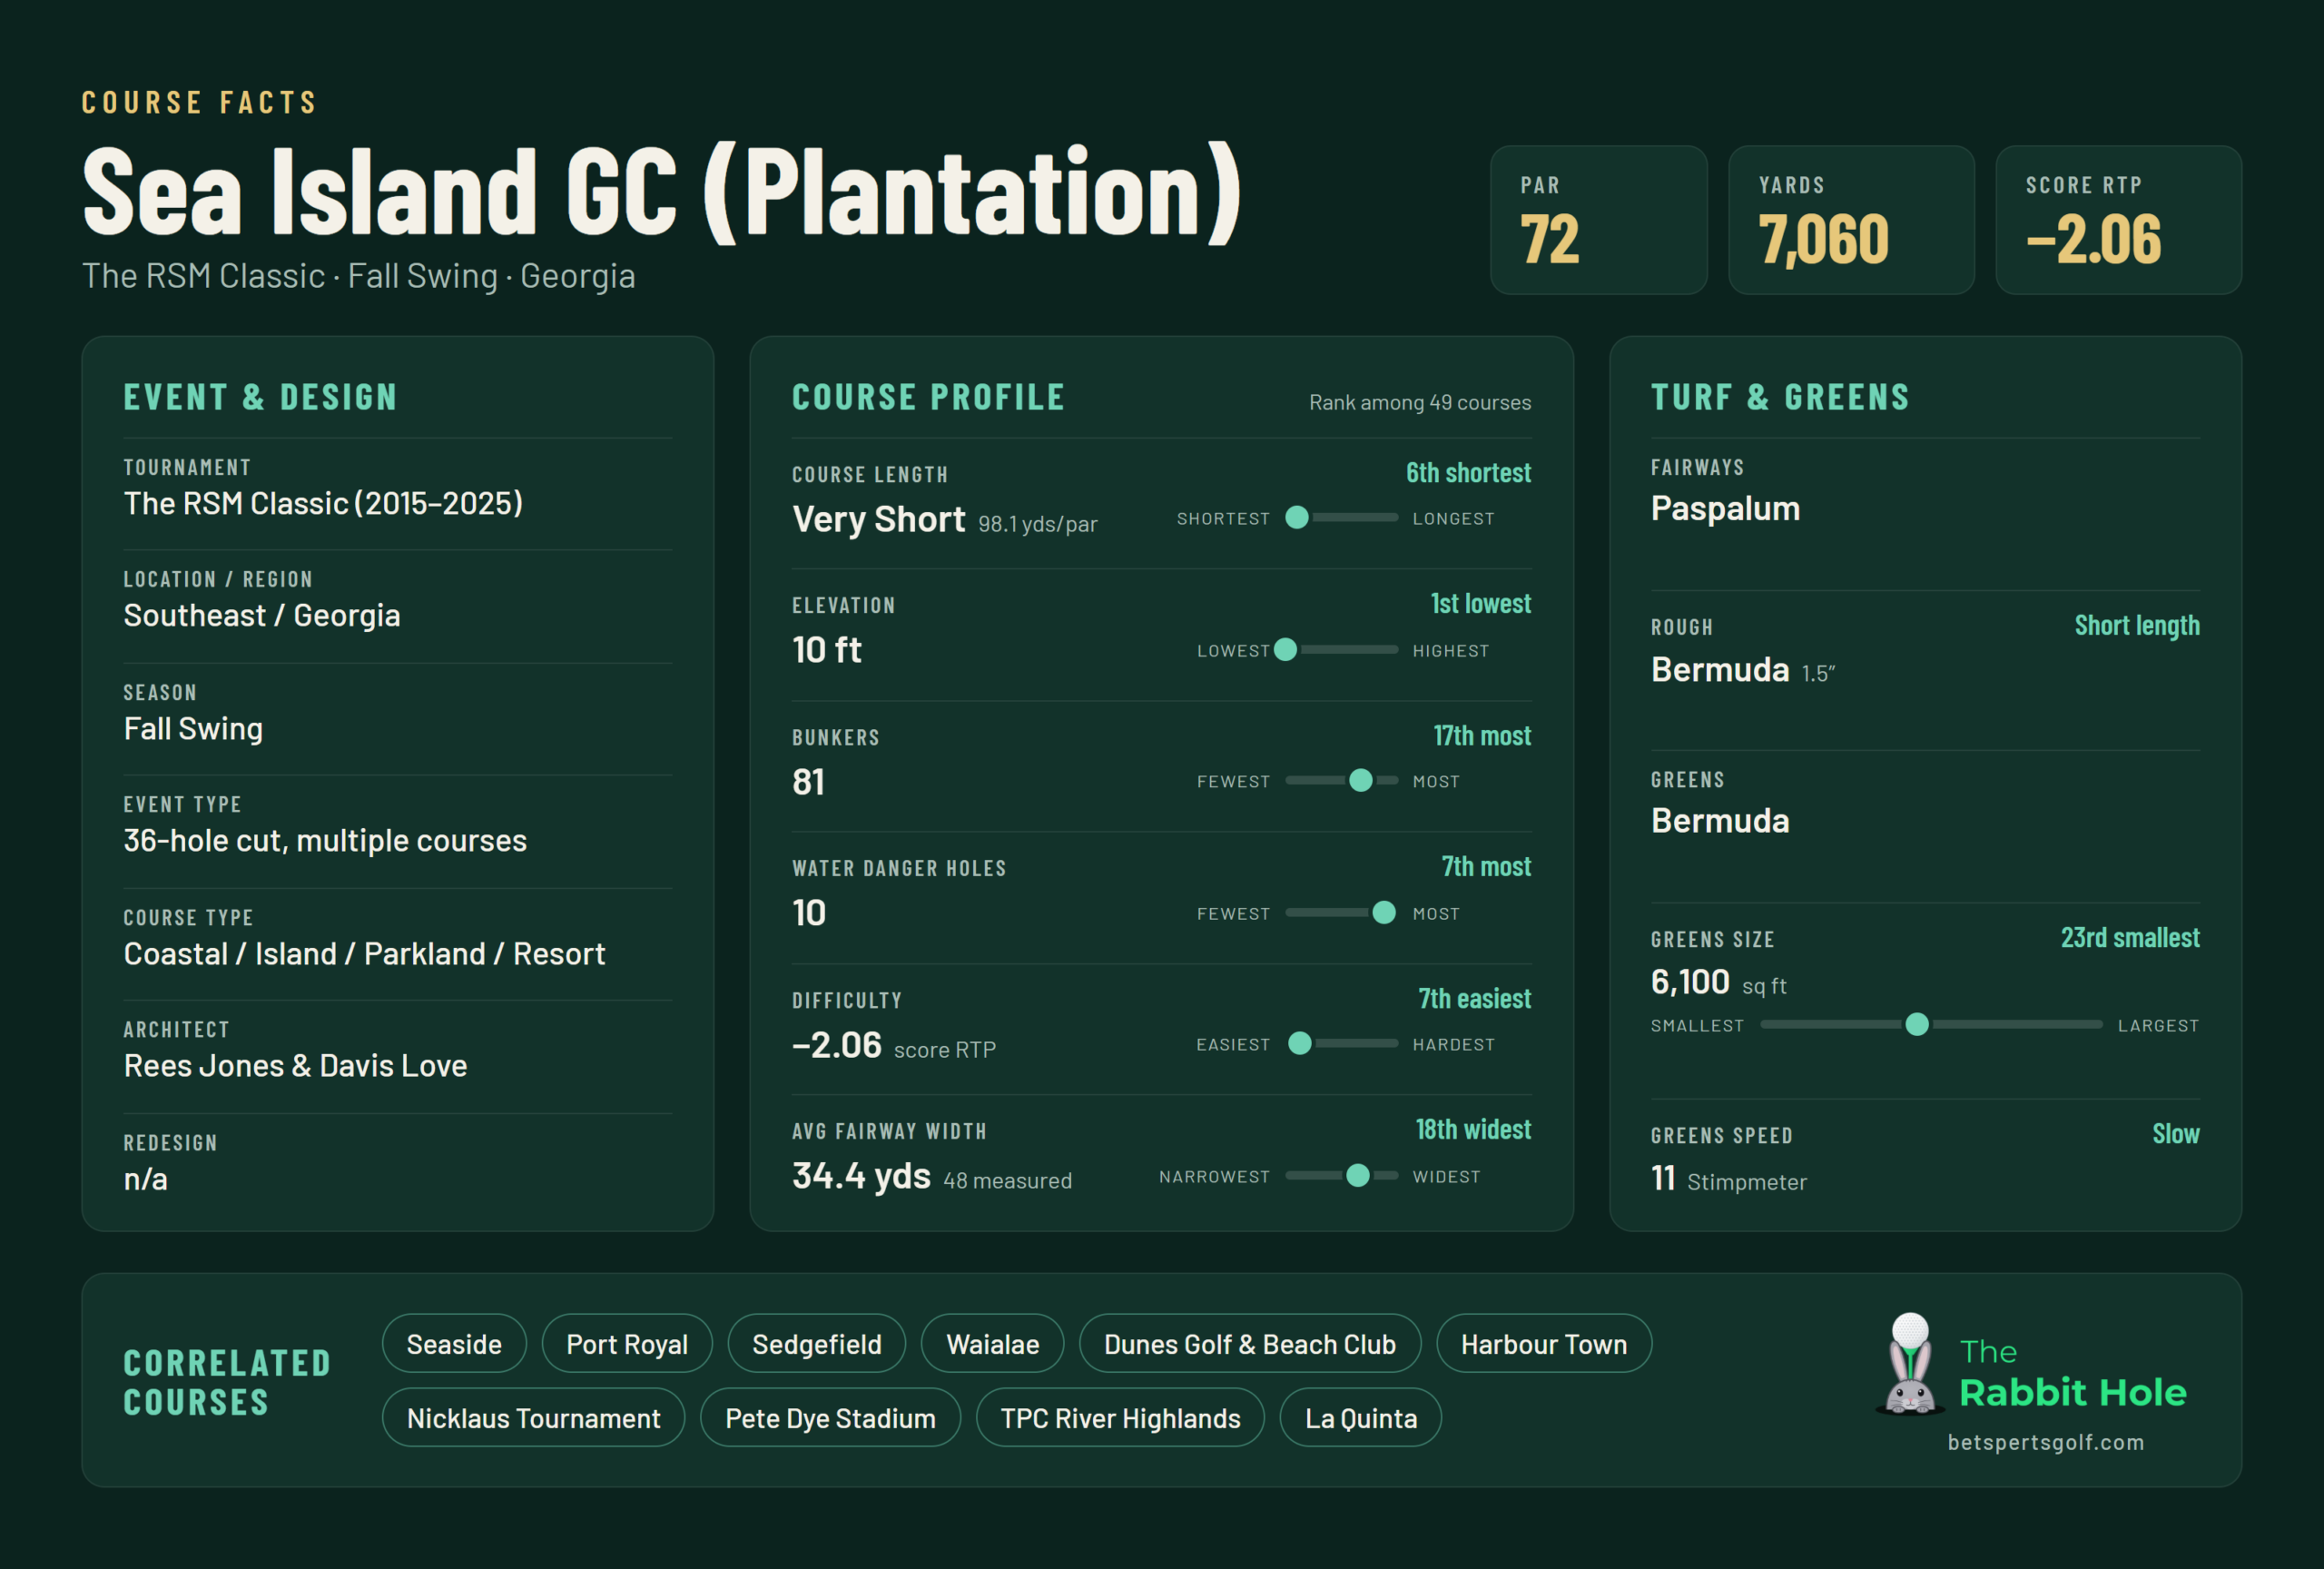
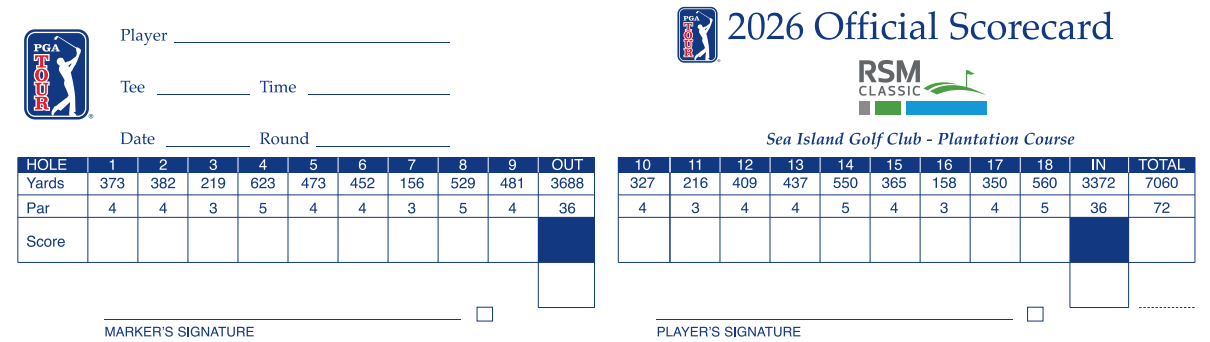
Compared to Seaside, Plantation is more of a tree-lined parkland course and is much less exposed to the coastal winds. Players have remarked that it has a distinct “Carolina” feel and have compared it to Harbour Town. Since Davis Love III and his brother Mark redesigned it in 2019, the course has been well received by players and demands far more thought and creativity than it did before.
Plantation features wide Platinum Paspalum fairways, 1.5-inch Bermuda rough and greens that roll between 11 and 12 on the Stimpmeter. At 7,060 yards, it is the sixth shortest course on Tour relative to par, and players hit driver on 71% of tee shots on its par 4s and par 5s, slightly below the Tour average. Tidal creeks and lakes are in play on 10 holes, and its 81 bunkers are nearly twice as many as Seaside has.
Plantation plays easier than Seaside, largely because of its four par 5s, which include the three easiest holes on the course over the past five years. Even so, its green complexes are far more demanding than they were before the redesign, with distinct quadrants and much more pronounced undulation. The field averaged nearly four under par there last year, the lowest mark for the course in our data dating back to 2016.
Each stat correlated per round with SG: Total, 2017 to 2025, newer seasons weighted more. Higher is always better: stats where a lower number is better are flipped. +/- is course minus PGA Tour average. Course Rank is this course among all PGA Tour events on that stat. Impact: 50 = the stat comes up as often as at the average course, 100 = twice as often or more. Hover over an Impact score for how often the stat comes up here. Click a column header to sort.
| Course Metric Correlation ChartSea Island GC (Seaside)The RSM Classic | ||||||||
|---|---|---|---|---|---|---|---|---|
| 1 | SG: Par 4s | +0.841 | +0.790 | +0.052 | 2/54 | 57 | 2 | Scoring |
| 2 | Birdie to Bogey Ratio | +0.811 | +0.770 | +0.041 | 12/47 | 4 | Scoring | |
| 3 | SG: Tee-to-Green | +0.771 | +0.810 | -0.039 | 48/48 | 45 | 1 | Strokes Gained |
| 4 | Bogey AvoidanceLower is better, flipped | +0.750 | +0.785 | -0.035 | 53/55 | 39 | 3 | Scoring |
| 5 | Birdie or Better % | +0.747 | +0.726 | +0.020 | 22/55 | 51 | 5 | Scoring |
| 6 | SG: Short Game | +0.717 | +0.711 | +0.006 | 18/48 | 52 | 6 | Strokes Gained |
| 7 | SG: Ball-Striking | +0.690 | +0.709 | -0.019 | 40/48 | 48 | 7 | Strokes Gained |
| 8 | Putting AverageLower is better, flipped | +0.655 | +0.561 | +0.094 | 4/47 | 56 | 11 | Putting |
| 9 | SG: Putting | +0.647 | +0.596 | +0.052 | 2/48 | 59 | 9 | Strokes Gained |
| 10 | SG: Par 4s 401-450 yds | +0.636 | +0.502 | +0.134 | 1/54 | 78 | 14 | Scoring |
| 11 | Birdie or Better % – Fairway | +0.625 | +0.592 | +0.034 | 9/47 | 55 | 10 | Scoring |
| 12 | Par 4 BoB % | +0.605 | +0.536 | +0.069 | 4/55 | 63 | 13 | Scoring |
| 13 | SG: Approach the Green | +0.541 | +0.606 | -0.064 | 48/48 | 43 | 8 | Strokes Gained |
| 14 | Greens in Regulation % | +0.522 | +0.537 | -0.015 | 40/54 | 50 | 12 | Approach |
| 15 | SG: Par 4s 351-400 yds | +0.495 | +0.371 | +0.124 | 2/52 | 96 | 34 | Scoring |
| 16 | SG: Putting per putt 10+ ft | +0.473 | +0.413 | +0.060 | 3/46 | 57 | 22 | Putting |
| 17 | One-Putt % | +0.445 | +0.393 | +0.052 | 3/54 | 44 | 28 | Putting |
| 18 | SG: Putting per putt 5-15 ft | +0.435 | +0.413 | +0.022 | 10/46 | 48 | 23 | Putting |
| 19 | Scrambling | +0.433 | +0.484 | -0.051 | 51/54 | 38 | 15 | Around the Green |
| 20 | SG: Par 3s | +0.433 | +0.463 | -0.030 | 44/54 | 50 | 18 | Scoring |
| 21 | Average Distance of Putts made | +0.431 | +0.391 | +0.040 | 6/41 | 29 | Putting | |
| 22 | SG: Putting per putt Inside 10 ft | +0.430 | +0.416 | +0.015 | 14/49 | 49 | 19 | Putting |
| 23 | SG: Off-the-Tee | +0.425 | +0.416 | +0.010 | 19/48 | 59 | 20 | Strokes Gained |
| 24 | Putting from – > 10 | +0.422 | +0.359 | +0.063 | 3/46 | 56 | 40 | Putting |
| 25 | Cost of Right Miss OTTLower is better, flipped | +0.410 | +0.383 | +0.028 | 7/46 | 42 | 32 | Off the Tee |
| 26 | Putting from 5-15 | +0.407 | +0.386 | +0.021 | 11/41 | 48 | 31 | Putting |
| 27 | Good Drive % | +0.401 | +0.412 | -0.012 | 36/54 | 50 | 24 | Off the Tee |
| 28 | SG: APP per shot from Fairway | +0.394 | +0.399 | -0.005 | 26/46 | 55 | 27 | Approach |
| 29 | Putts Made Per Round Over 10 | +0.394 | +0.345 | +0.049 | 3/46 | 57 | 42 | Putting |
| 30 | SG: Par 5s | +0.393 | +0.473 | -0.080 | 47/54 | 32 | 17 | Scoring |
| 31 | Proximity to HoleLower is better, flipped | +0.386 | +0.360 | +0.027 | 14/46 | 39 | Approach | |
| 32 | Double Bogey %Lower is better, flipped | +0.381 | +0.409 | -0.028 | 38/54 | 39 | 25 | Scoring |
| 33 | Penalty %Lower is better, flipped | +0.366 | +0.338 | +0.027 | 16/47 | 53 | 43 | Scoring |
| 34 | 3-Putt AvoidanceLower is better, flipped | +0.361 | +0.294 | +0.067 | 1/54 | 48 | 54 | Putting |
| 35 | All approaches inside 15 ft % | +0.357 | +0.361 | -0.003 | 28/46 | 57 | 37 | Approach |
| 36 | All approaches inside 10 ft % | +0.350 | +0.325 | +0.025 | 12/46 | 57 | 44 | Approach |
| 37 | Cost of RoughLower is better, flipped | +0.340 | +0.413 | -0.073 | 42/46 | 34 | 21 | Off the Tee |
| 38 | Putting – Inside 10 | +0.334 | +0.360 | -0.027 | 30/41 | 49 | 38 | Putting |
| 39 | Cost of Left Miss OTTLower is better, flipped | +0.332 | +0.374 | -0.041 | 43/46 | 36 | 33 | Off the Tee |
| 40 | Par 5 BoB % | +0.331 | +0.391 | -0.059 | 47/55 | 36 | 30 | Scoring |
| 41 | SG: Par 5s 551-600 yds | +0.328 | +0.370 | -0.042 | 33/50 | 46 | 35 | Scoring |
| 42 | Fairway ProximityLower is better, flipped | +0.327 | +0.292 | +0.035 | 13/47 | 54 | 56 | Approach |
| 43 | SG: Around-the-Green | +0.318 | +0.399 | -0.081 | 46/48 | 36 | 26 | Strokes Gained |
| 44 | SG: APP per shot 151-200 yds | +0.307 | +0.364 | -0.057 | 43/47 | 48 | 36 | Approach |
| 45 | SG: Par 3s 176-200 yds | +0.305 | +0.300 | +0.005 | 23/52 | 66 | 52 | Scoring |
| 46 | Scrambling from Short Grass | +0.304 | +0.314 | -0.009 | 32/51 | 48 | 45 | Around the Green |
| 47 | SG: Putting per putt 5-10 ft | +0.301 | +0.310 | -0.009 | 30/46 | 46 | 47 | Putting |
| 48 | SG: Par 3s 201-225 yds | +0.298 | +0.282 | +0.016 | 16/53 | 78 | 63 | Scoring |
| 49 | GIR % from Fairway | +0.296 | +0.302 | -0.005 | 30/54 | 57 | 50 | Approach |
| 50 | SG: Par 4s 451-500 yds | +0.295 | +0.475 | -0.180 | 51/53 | 27 | 16 | Scoring |
| 51 | Par 3 BoB % | +0.294 | +0.289 | +0.005 | 22/54 | 52 | 59 | Scoring |
| 52 | Putting from 4-8 | +0.293 | +0.289 | +0.004 | 22/41 | 46 | 60 | Putting |
| 53 | Scrambling from the Rough | +0.290 | +0.291 | -0.001 | 29/51 | 37 | 57 | Around the Green |
| 54 | SG: Par 5s 501-550 yds | +0.289 | +0.355 | -0.066 | 38/50 | 28 | 41 | Scoring |
| 55 | Right Rough Tendency (RTP Score)Lower is better, flipped | +0.289 | +0.312 | -0.023 | 30/41 | 46 | Off the Tee | |
| 56 | Going for the Green – Birdie or Better | +0.286 | +0.298 | -0.012 | 27/47 | 37 | 53 | Scoring |
| 57 | SG: Putting per putt 10-15 ft | +0.285 | +0.241 | +0.043 | 4/46 | 51 | 73 | Putting |
| 58 | GIR % from Other than Fairway | +0.283 | +0.288 | -0.005 | 31/54 | 39 | 61 | Approach |
| 59 | Putting from 5-10 | +0.283 | +0.301 | -0.019 | 36/47 | 46 | 51 | Putting |
| 60 | SG: Putting per putt 4-8 ft | +0.281 | +0.289 | -0.009 | 30/46 | 46 | 58 | Putting |
| 61 | SG: APP per shot 101-150 yds | +0.277 | +0.287 | -0.009 | 31/46 | 59 | 62 | Approach |
| 62 | Putting from – 10-15 | +0.277 | +0.236 | +0.041 | 4/47 | 51 | 77 | Putting |
| 63 | SG: Putting per putt 20+ ft | +0.276 | +0.241 | +0.035 | 6/46 | 59 | 74 | Putting |
| 64 | Birdie or Better % – Rough | +0.268 | +0.250 | +0.019 | 15/47 | 43 | 67 | Scoring |
| 65 | 3-Putt Avoidance > 25Lower is better, flipped | +0.264 | +0.223 | +0.041 | 6/46 | 56 | 80 | Putting |
| 66 | Water Avoidance | +0.256 | +0.243 | +0.012 | 25/44 | 65 | 71 | Scoring |
| 67 | All approaches inside 5 ft % | +0.249 | +0.238 | +0.011 | 19/46 | 57 | 75 | Approach |
| 68 | Left Rough Tendency (RTP Score)Lower is better, flipped | +0.248 | +0.306 | -0.057 | 39/41 | 48 | Off the Tee | |
| 69 | Bounce Back % | +0.247 | +0.251 | -0.004 | 32/54 | 39 | 66 | Scoring |
| 70 | Scrambling from > 30 yards | +0.246 | +0.243 | +0.003 | 21/46 | 46 | 72 | Around the Green |
| 71 | SG: APP per shot from Tee (par 3s) | +0.242 | +0.304 | -0.062 | 46/49 | 49 | 49 | Approach |
| 72 | SG: Par 3s 151-175 yds | +0.240 | +0.268 | -0.028 | 33/49 | 28 | 64 | Scoring |
| 73 | Putting from 15-25 | +0.240 | +0.209 | +0.031 | 7/41 | 60 | 84 | Putting |
| 74 | Putting from Inside 5 | +0.238 | +0.217 | +0.021 | 11/47 | 50 | 81 | Putting |
| 75 | OTT Water Balls %Lower is better, flipped | +0.237 | +0.167 | +0.069 | 7/38 | 100 | 98 | Off the Tee |
| 76 | Putting from – > 20 | +0.233 | +0.201 | +0.032 | 9/41 | 57 | 86 | Putting |
| 77 | SG: APP per shot 200+ yds | +0.233 | +0.293 | -0.060 | 46/48 | 38 | 55 | Approach |
| 78 | Putts Made Per Round Over 20 | +0.229 | +0.217 | +0.012 | 11/47 | 82 | Putting | |
| 79 | SG: ARG per shot from Rough | +0.220 | +0.215 | +0.005 | 21/46 | 30 | 83 | Around the Green |
| 80 | SG: APP per shot 201-250 yds | +0.219 | +0.237 | -0.018 | 35/48 | 41 | 76 | Approach |
| 81 | Driving Accuracy % | +0.219 | +0.249 | -0.031 | 38/54 | 50 | 68 | Off the Tee |
| 82 | Hit Fairway % | +0.214 | +0.247 | -0.033 | 36/46 | 50 | 70 | Off the Tee |
| 83 | Total DrivingLower is better, flipped | +0.210 | +0.260 | -0.050 | 41/46 | 65 | Off the Tee | |
| 84 | Putting from – 15-20 | +0.209 | +0.178 | +0.030 | 3/47 | 57 | 94 | Putting |
| 85 | SG: Putting per putt 15-20 ft | +0.206 | +0.184 | +0.022 | 8/46 | 60 | 92 | Putting |
| 86 | Approaches 101-150 yds inside 10 ft % | +0.205 | +0.184 | +0.022 | 16/46 | 69 | 93 | Approach |
| 87 | Sand Save % | +0.204 | +0.228 | -0.024 | 45/54 | 37 | 78 | Around the Green |
| 88 | SG: Putting per putt 3-5 ft | +0.199 | +0.190 | +0.009 | 18/46 | 49 | 89 | Putting |
| 89 | Putting from 3-5 | +0.199 | +0.188 | +0.010 | 15/47 | 49 | 91 | Putting |
| 90 | SG: ARG per shot from Short Grass | +0.198 | +0.197 | +0.001 | 19/46 | 45 | 88 | Around the Green |
| 91 | SG: APP per shot from Rough | +0.197 | +0.248 | -0.051 | 43/46 | 34 | 69 | Approach |
| 92 | Proximity to Hole (ARG)Lower is better, flipped | +0.196 | +0.225 | -0.028 | 41/47 | 38 | 79 | Around the Green |
| 93 | Approaches 101-150 yds inside 15 ft % | +0.196 | +0.203 | -0.008 | 28/46 | 69 | 85 | Approach |
| 94 | SG: APP per shot 51-100 yds | +0.192 | +0.171 | +0.021 | 13/46 | 51 | 96 | Approach |
| 95 | Approaches 151-175 yds inside 15 ft % | +0.173 | +0.151 | +0.021 | 11/46 | 59 | 107 | Approach |
| 96 | Approaches from 125-150 yardsLower is better, flipped | +0.167 | +0.141 | +0.026 | 11/47 | 61 | 109 | Approach |
| 97 | SG: APP per shot from Fairway Bunker | +0.166 | +0.168 | -0.002 | 24/46 | 45 | 97 | Approach |
| 98 | Putting from – > 25 | +0.162 | +0.152 | +0.010 | 16/47 | 56 | 106 | Putting |
| 99 | Approaches from 175-200 yards (Rgh)Lower is better, flipped | +0.159 | +0.104 | +0.056 | 6/47 | 44 | 140 | Approach |
| 100 | Eagle % | +0.157 | +0.177 | -0.020 | 43/54 | 38 | 95 | Scoring |
| 101 | Putting from – 20-25 | +0.156 | +0.138 | +0.018 | 13/47 | 57 | 112 | Putting |
| 102 | Approaches 50-100 yds inside 10 ft % | +0.155 | +0.131 | +0.023 | 12/46 | 64 | 120 | Approach |
| 103 | Approaches from 150-175 yardsLower is better, flipped | +0.154 | +0.154 | +0.001 | 23/47 | 53 | 105 | Approach |
| 104 | Approaches from 200-225 yardsLower is better, flipped | +0.154 | +0.136 | +0.017 | 14/47 | 52 | 116 | Approach |
| 105 | Approaches 101-150 yds inside 5 ft % | +0.152 | +0.136 | +0.016 | 12/46 | 69 | 115 | Approach |
| 106 | Proximity to Hole from RoughLower is better, flipped | +0.149 | +0.130 | +0.019 | 16/46 | 36 | 121 | Around the Green |
| 107 | Approaches 50-100 yds inside 15 ft % | +0.146 | +0.138 | +0.008 | 19/46 | 64 | 113 | Approach |
| 108 | Approaches from 175-200 yardsLower is better, flipped | +0.144 | +0.155 | -0.011 | 26/47 | 49 | 104 | Approach |
| 109 | SG: ARG per shot from Bunker | +0.143 | +0.190 | -0.047 | 42/46 | 29 | 90 | Around the Green |
| 110 | Approaches 151-175 yds inside 10 ft % | +0.142 | +0.134 | +0.008 | 19/46 | 59 | 117 | Approach |
| 111 | Approaches from 50-125 yardsLower is better, flipped | +0.141 | +0.156 | -0.016 | 37/47 | 56 | 102 | Approach |
| 112 | Approaches from > 200 yardsLower is better, flipped | +0.140 | +0.132 | +0.009 | 21/47 | 46 | 119 | Approach |
| 113 | Approaches from 225-250 yardsLower is better, flipped | +0.139 | +0.116 | +0.023 | 12/47 | 43 | 132 | Approach |
| 114 | Average Distance after Going for it ShotLower is better, flipped | +0.135 | +0.159 | -0.024 | 35/47 | 37 | 99 | Approach |
| 115 | Distance from Edge of FairwayLower is better, flipped | +0.127 | +0.099 | +0.028 | 10/47 | 37 | 142 | Off the Tee |
| 116 | SG: APP per shot from Other Lies | +0.125 | +0.146 | -0.021 | 32/46 | 48 | 108 | Approach |
| 117 | Approaches from inside 100 yardsLower is better, flipped | +0.123 | +0.125 | -0.002 | 28/46 | 49 | 124 | Approach |
| 118 | GIR % – Fairway Bunker | +0.118 | +0.140 | -0.022 | 31/41 | 46 | 111 | Approach |
| 119 | Approaches from 150-175 yards (Rgh)Lower is better, flipped | +0.118 | +0.108 | +0.010 | 18/47 | 47 | 137 | Approach |
| 120 | Approaches from 50-125 yards (Rgh)Lower is better, flipped | +0.115 | +0.123 | -0.008 | 35/47 | 46 | 127 | Approach |
| 121 | Approaches 50-100 yds inside 5 ft % | +0.113 | +0.104 | +0.010 | 15/46 | 64 | 139 | Approach |
| 122 | Approaches from 100-125 yardsLower is better, flipped | +0.112 | +0.137 | -0.024 | 38/47 | 56 | 114 | Approach |
| 123 | Approaches from 75-100 yardsLower is better, flipped | +0.112 | +0.121 | -0.008 | 32/47 | 48 | 129 | Approach |
| 124 | Rough ProximityLower is better, flipped | +0.112 | +0.121 | -0.010 | 35/47 | 39 | 128 | Approach |
| 125 | Going for the Green – Hit Green % | +0.111 | +0.132 | -0.021 | 35/47 | 37 | 118 | Approach |
| 126 | Approaches 176-200 yds inside 15 ft % | +0.101 | +0.130 | -0.029 | 41/46 | 51 | 122 | Approach |
| 127 | Approaches 200+ yds inside 10 ft % | +0.098 | +0.105 | -0.007 | 28/46 | 45 | 138 | Approach |
| 128 | Proximity to Hole from Short GrassLower is better, flipped | +0.097 | +0.125 | -0.028 | 39/46 | 49 | 125 | Around the Green |
| 129 | Approaches from 50-75 yardsLower is better, flipped | +0.095 | +0.116 | -0.021 | 32/47 | 51 | 131 | Approach |
| 130 | Approaches from 100-125 yards (Rgh)Lower is better, flipped | +0.095 | +0.119 | -0.024 | 35/45 | 47 | 130 | Approach |
| 131 | Approaches 151-175 yds inside 5 ft % | +0.094 | +0.096 | -0.001 | 27/46 | 59 | 145 | Approach |
| 132 | Proximity to Hole from SandLower is better, flipped | +0.091 | +0.115 | -0.024 | 38/46 | 39 | 134 | Around the Green |
| 133 | Approach Putt PerformanceLower is better, flipped | +0.091 | +0.077 | +0.014 | 13/47 | 54 | 150 | Putting |
| 134 | Approaches 200+ yds inside 15 ft % | +0.087 | +0.125 | -0.038 | 45/46 | 45 | 126 | Approach |
| 135 | APP Water Balls %Lower is better, flipped | +0.085 | +0.199 | -0.114 | 40/44 | 22 | 87 | Approach |
| 136 | Approaches from 250+ yardsLower is better, flipped | +0.082 | +0.090 | -0.008 | 29/47 | 43 | 148 | Approach |
| 137 | Approaches 176-200 yds inside 10 ft % | +0.081 | +0.112 | -0.031 | 44/46 | 51 | 135 | Approach |
| 138 | Approaches from 125-150 yards (Rgh)Lower is better, flipped | +0.080 | +0.115 | -0.036 | 42/46 | 49 | 133 | Approach |
| 139 | SG: APP per shot 250+ yds | +0.078 | +0.157 | -0.079 | 45/46 | 33 | 101 | Approach |
| 140 | Going for the Green | +0.075 | +0.157 | -0.082 | 47/47 | 35 | 100 | Approach |
| 141 | Lower Driver Usage % | +0.074 | +0.076 | -0.003 | 24/45 | 51 | 152 | Off the Tee |
| 142 | Approaches 200+ yds inside 5 ft % | +0.063 | +0.069 | -0.007 | 26/46 | 45 | 153 | Approach |
| 143 | Approaches 176-200 yds inside 5 ft % | +0.060 | +0.077 | -0.016 | 38/46 | 51 | 151 | Approach |
| 144 | Driving Distance – All Drives | +0.056 | +0.155 | -0.099 | 47/47 | 103 | Off the Tee | |
| 145 | Average Distance of Birdie putts made | +0.052 | +0.050 | +0.002 | 23/41 | 156 | Putting | |
| 146 | Club Head Speed | +0.049 | +0.092 | -0.043 | 39/45 | 147 | Off the Tee | |
| 147 | Lower Launch Angle | +0.045 | +0.028 | +0.017 | 11/45 | 157 | Off the Tee | |
| 148 | Ball Speed | +0.040 | +0.099 | -0.059 | 45/46 | 141 | Off the Tee | |
| 149 | Average Approach Shot Distance | +0.040 | +0.109 | -0.069 | 45/46 | 136 | Approach | |
| 150 | Distance from Center of FairwayLower is better, flipped | +0.038 | +0.026 | +0.012 | 15/41 | 58 | 158 | Off the Tee |
| 151 | Driving % 300+ (All Drives) | +0.031 | +0.125 | -0.095 | 41/41 | 123 | Off the Tee | |
| 152 | Carry Distance | +0.027 | +0.096 | -0.069 | 45/46 | 144 | Off the Tee | |
| 153 | Rough TendencyLower is better, flipped | +0.026 | +0.141 | -0.114 | 44/46 | 50 | 110 | Off the Tee |
| 154 | Lower Apex Height | +0.023 | -0.033 | +0.056 | 4/46 | 162 | Off the Tee | |
| 155 | Driving % 280-300 (All Drives) | +0.020 | -0.024 | +0.045 | 8/41 | 161 | Off the Tee | |
| 156 | Driving % 320+ (All Drives) | +0.014 | +0.093 | -0.079 | 44/46 | 146 | Off the Tee | |
| 157 | Right Rough TendencyLower is better, flipped | +0.012 | +0.079 | -0.068 | 38/41 | 51 | 149 | Off the Tee |
| 158 | Lower Spin Rate | +0.005 | +0.002 | +0.003 | 23/45 | 159 | Off the Tee | |
| 159 | Total Distance Efficiency | -0.007 | +0.066 | -0.073 | 46/46 | 154 | Off the Tee | |
| 160 | Left Rough TendencyLower is better, flipped | -0.012 | +0.097 | -0.109 | 41/41 | 51 | 143 | Off the Tee |
| 161 | Right TendencyLower is better, flipped | -0.043 | -0.055 | +0.012 | 11/46 | 40 | 163 | Off the Tee |
| 162 | Par % | -0.058 | +0.052 | -0.110 | 45/55 | 53 | 155 | Scoring |
| 163 | Left TendencyLower is better, flipped | -0.059 | -0.023 | -0.036 | 39/46 | 41 | 160 | Off the Tee |
Strokes Gained Analysis
*This section will mostly focus on the Seaside course because there is no ShotLink data nor strokes gained metrics used at Plantation.
Off the Tee
Driver is the club of choice off the tee at Seaside. Players have hit driver on 81% of par-4 and par-5 tee shots over the past decade, well above the Tour average of 73%, and the added length on the par 4s should push that number even higher this week. Even so, the ball does not travel far here. The average drive has measured just 280 yards since 2016, the eighth shortest on Tour.
That lack of distance has not cost players much, because length provides very little advantage at Seaside. It ranks 27th out of 30 courses on Tour in how strongly driving distance relates to strokes gained total, while driving accuracy carries about the same weight as it does at an average Tour stop. The last 11 winners have ranked an average of 35th in driving distance during their winning week, and only Charles Howell III and Ludvig Aberg ranked inside the top 10.
The generous fairways have also been easy to find. Players have hit 70.5% of fairways at Seaside since 2016, the second highest rate on Tour and 10 percentage points above the Tour average. Missing them has rarely been costly, either. Seaside has ranked inside the top six in lowest penalty for drives that finish in the rough in each of the past five years, including first last year.
However, accuracy still matters, just in a different way. Most holes bring water or marshland into play, and 2.7% of tee shots on par 4s and par 5s have resulted in a penalty since 2016, the fourth highest rate on Tour and well above the Tour average of 1.9%. In 2024, no course on Tour produced more penalty strokes off the tee. Players who get loose with the driver can rack up big numbers quickly despite the wide landing areas.
Approach
On approach, players will be attacking larger-than-average greens during the three Seaside rounds. Those greens, combined with potentially gusty coastal winds, will give an advantage to players who are sharp with their irons. Approaches at Seaside are concentrated in the middle of the bag, with about 41% coming from 125 to 175 yards over the past five years compared to 33% on Tour. Only one in five has come from 200 yards or more, well below the Tour rate of 27%.
Seaside has been one of the easier courses on Tour to gain strokes on approach. It ranks as the fifth easiest approach course, with players gaining 0.03 strokes per shot. The wind can change that quickly, though. When it blew in 2024, Seaside fell to 27th out of 38 courses. Over the past five years, players have hit 74.5% of greens in regulation, the fifth highest rate on Tour and well above the Tour average of 67%.
With wide fairways and large greens, this week often turns into a putting contest, but only for those who can consistently attack flags on the correct side of these sloped surfaces. Finding the green is the easy part. Approaches that land on the putting surface at Seaside have still left an average of 23 feet, slightly longer than the Tour average, because of how much green there is to work with. Over the past five editions, 84% of top-10 finishers gained strokes on approach across their three Seaside rounds, averaging 2.3 strokes.
Seaside’s greens have always featured subtle but tricky undulations, and an approach that finishes in the wrong section of the green can turn a birdie chance into a lag putt. Navigating these contours and leaving makeable putts will be a major separator.
Around the Green
Short game has carried less weight at Seaside than at any other course on Tour. Only about 11% of the variation in strokes gained here comes from around the green, the lowest share from ShotLink courses and well below the Tour average of 15%. With greens hit at such a high rate, players face fewer of these shots, and the ones they do face have been on the easier side. The field has gained 0.03 strokes per short-game shot, the seventh easiest mark on Tour.
Short grass is the most common lie. Just over half of all chips and pitches at Seaside come from the fringe and the closely mown areas around the greens, compared with 42% on Tour. Players get up and down from these lies 71.5% of the time, right in line with the Tour average, and the average shot finishes about six feet from the hole. These spots give players the option to putt, chip or bump the ball into a slope, so touch and good decisions matter more than a high-spinning wedge.
The rough is the toughest place to miss. About 31% of short-game shots come from the rough, fewer than the Tour rate of 37%, but players have gotten up and down just 53.6% of the time from these lies. That ranks 28th out of 37 courses and sits three points below the Tour average, with the typical shot finishing about nine feet away.
Bunkers, on the other hand, have been the friendliest lie. Only 16% of short-game shots come from the sand, compared with 20% on Tour, and players get up and down from greenside bunkers 56.2% of the time. That is the third highest rate on Tour and nearly six points above average.
Overall scrambling has been close to average. Players who miss a green at Seaside have saved par or better 60.3% of the time, which ranks 25th out of 46 courses and sits just under the Tour average of 61.2%. That rate moves with the wind, dropping to 56.1% in 2024 before climbing back to 60.6% last year. With so little separation coming from around the green, a solid short game here is more about avoiding mistakes than gaining ground.
Putting
With so little separating the field from tee to green, the putter often decides the RSM Classic. About 40% of the variation in strokes gained at Seaside comes from putting, the third highest share of the 30 ShotLink courses and above the Tour average of 36%.
These Bermuda greens do present some challenges. Along with being sloped and tiered, many on Seaside are exposed to the wind, and numerous players have mentioned how difficult putting can be when it starts to gust. Tom Hoge said, “Out there on Seaside, it’s very exposed, so you have a lot of putts, if you had a left-to-right breaker with the wind going in the opposite direction, it was very hard to figure out what the putt was going to do because the wind can grab it pretty good with some of those gusts out there.”
Along with the wind, the greens on Seaside approach 13 on the Stimpmeter and typically play as some of the fastest on Tour. Over a full five-year sample, though, Seaside’s greens have played close to Tour average. Players have holed putts at nearly the same rate as the Tour from every distance, making 89% from three to five feet and 58% from five to 10 feet, while three-putting on 3.3% of holes. The difficulty shows up from year to year instead. In the windy 2024 edition, Seaside ranked among the seven toughest courses on Tour to putt, while a year earlier it was the fourth easiest.

Get 25% off
Use code: BSG26
Use code: BSG26
BUILD YOUR OWN
CUSTOM STATS MODEL
FOR BETTING & DFS
CUSTOM STATS MODEL
FOR BETTING & DFS
New Users Only